This page presents a selection of visualizations from my research. While these simulations are certainly enjoyable to look at, they also showcase the numerical methods, software, and computational techniques developed throughout my work. They highlight challenging problems ranging from shock-dominated compressible flows to large-scale geophysical fluid dynamics, illustrating the scope of my research and the capabilities of the numerical methods I develop.
Viscous shock tube (compressible Navier–Stokes equations). A benchmark problem illustrating the interaction of shocks, boundary layers, and reflecting walls. The simulation demonstrates stabilized continuous finite elements with nonlinear limiting for convection-dominated parabolic problems.
Baroclinic instability (two-layer quasi-geostrophic model). Evolution of unstable Rossby waves computed with a semi-spectral discretization. This example highlights numerical methods for large-scale geophysical fluid dynamics.
Shock–bubble interaction (compressible Euler equations). Interaction of a strong shock wave with a light-density bubble. The simulation demonstrates element-based limiting techniques for continuous finite element discretizations of compressible flows.Kelvin–Helmholtz instability (compressible Euler equations). Formation of vortical structures driven by velocity shear. This example showcases discontinuous Galerkin discretizations together with nonlinear limiting for both volume and interface contributions.
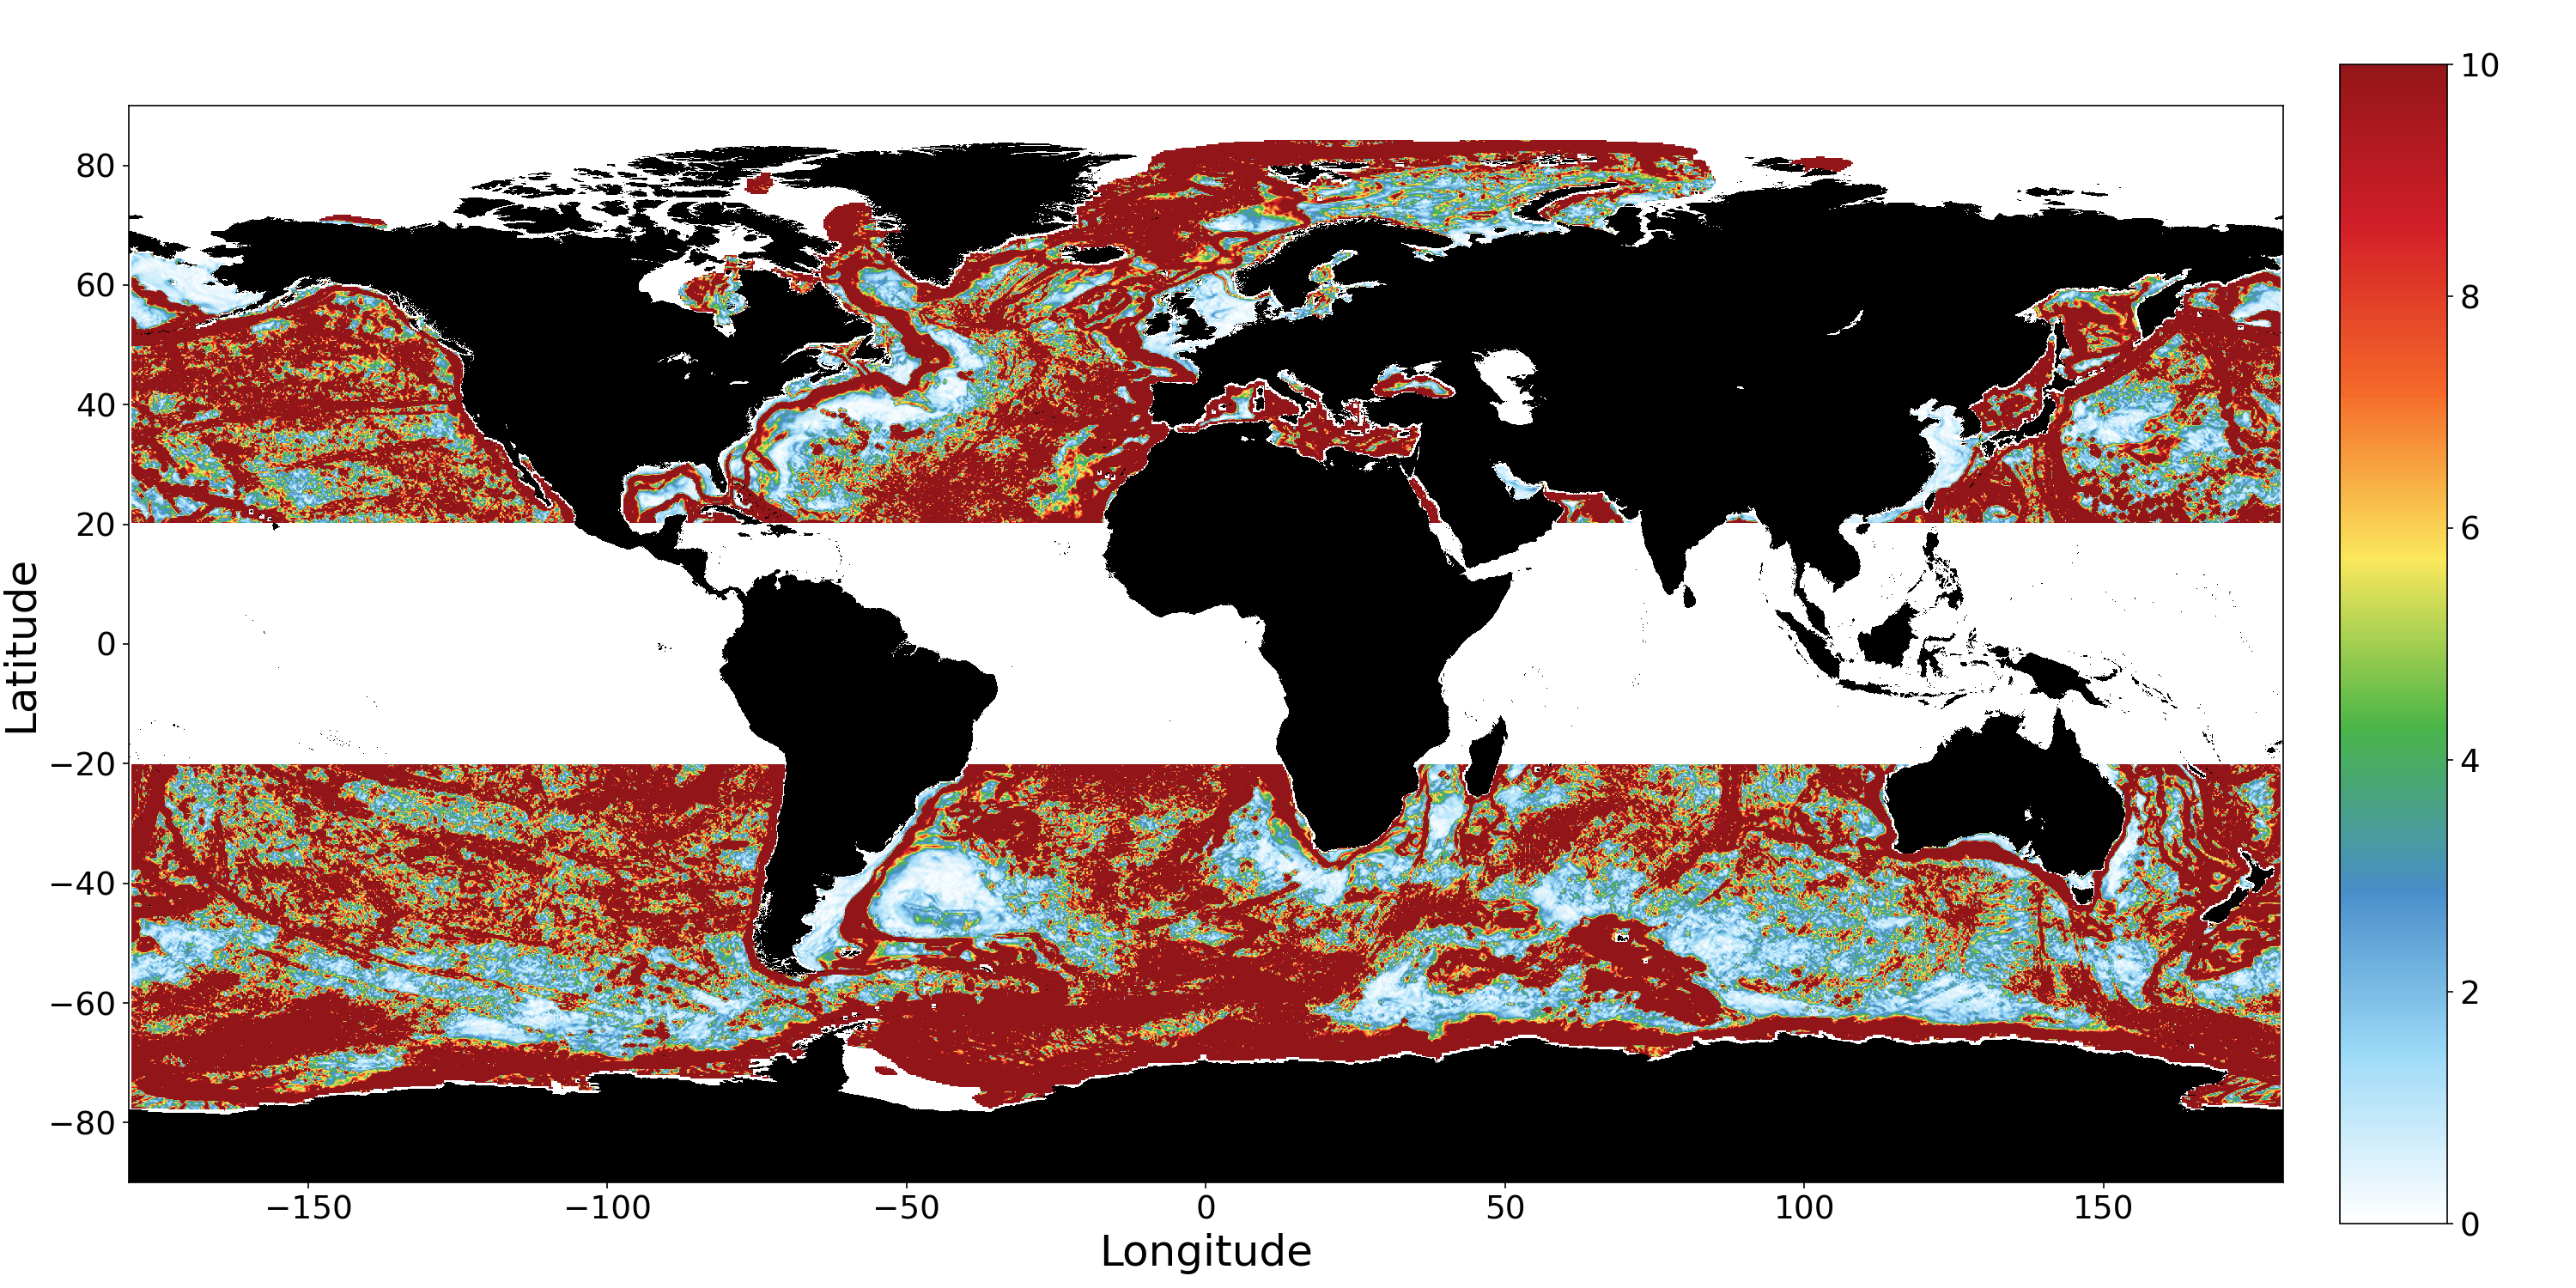
Global ocean diagnostics. Visualization of the ratio between topographic and critical slopes derived from observational ocean data. This example illustrates scientific data processing, large-scale visualization, and the analysis of geophysical data sets.